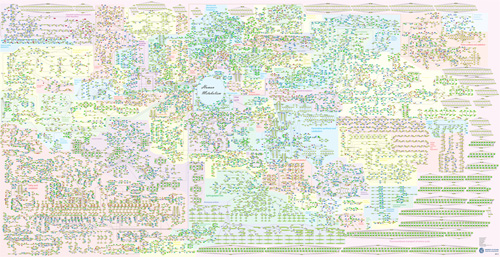
Recon 2 is the most comprehensive virtual reconstruction of the human metabolic network to date, assemble by an international consortium of researchers, who liken it to a ‘Google map’ of metabolism. Image Credit: Anna Dröfn Daníelsdóttir, Freyr Jóhannsson, Soffía Jónsdóttir, Sindri Jarlsson, Jón Pétur Gunnarsson & Ronan M. T. Fleming from the University of Iceland.
Building on earlier pioneering work by researchers at the University of California, San Diego, an international consortium of university researchers has produced the most comprehensive virtual reconstruction of human metabolism to date. Scientists could use the model, known as Recon 2, to identify causes of and new treatments for diseases like cancer, diabetes and even psychiatric and neurodegenerative disorders. Each person’s metabolism, which represents the conversion of food sources into energy and the assembly of molecules, is determined by genetics, environment and nutrition.
The researchers presented Recon 2 in a paper published online March 3 in the journal Nature Biotechnology.
Doctors have long recognized the importance of metabolic imbalances as an underlying cause of disease, but scientists have been ramping up their research on the connection as a result of compelling evidence enabled by the Human Genome Project and advances in systems biology, which leverages the power of high-powered computing to build vast interactive databases of biological information.
“Recon 2 allows biomedical researchers to study the human metabolic network with more precision than was ever previously possible. This is essential to understanding where and how specific metabolic pathways go off track to create disease,” said Bernhard Palsson, Galletti Professor of Bioengineering at UC San Diego Jacobs School of Engineering.
“It’s like having the coordinates of all the cars in town, but no street map. Without this tool, we don’t know why people are moving the way they are,” said Palsson.
He likened Recon 2 to Google mapping for its ability to merge complex details into a single, interactive map. For example, researchers looking at how metabolism sets the stage for cancerous tumor growth could zoom in on the “map” for finely detailed images of individual metabolic reactions or zoom out to look at patterns and relationships among pathways or different sectors of metabolism. This is not unlike how you can get a street view of a single house or zoom out to see how the house fits into the whole neighborhood, city, state, country and globe. And just as Google maps brings together a broad set of data – such as images, addresses, streets and traffic flow – into an easily navigated tool, Recon 2 pulls together a vast compendium of data from published literature and existing models of metabolic processes.
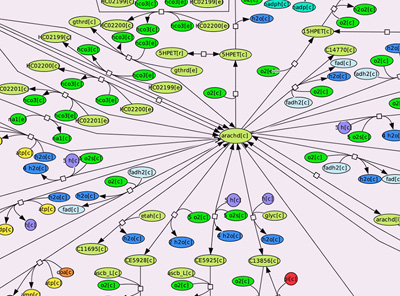
Researchers liken Recon 2 to Google mapping for its ability to merge complex details into a single, interactive map. For example, researchers looking at how metabolism sets the stage for cancerous tumor growth could zoom in on the “map” for finely detailed images of individual metabolic reactions or zoom out to look at patterns and relationships among pathways or different sectors of metabolism. Image Credit: Anna Dröfn Daníelsdóttir, Freyr Jóhannsson, Soffía Jónsdóttir, Sindri Jarlsson, Jón Pétur Gunnarsson & Ronan M. T. Fleming from the University of Iceland.
As a multi-scale representation of the human metabolic network, Recon 2 provides essential context for data being reviewed by researchers. Palsson and other scientists in the field have already successfully demonstrated the utility of such models in simple organisms such as yeast and E.coli. As a result, they have been able to engineer these organisms in the lab to improve the efficiency of ethanol production and predict drug resistance in bacteria.
One of the most promising applications for the network reconstruction is the ability to identify specific gene expressions and their metabolic pathways for targeted drug delivery. Large gene expression databases are available for human cells that have been treated with molecules extracted from existing drugs as well as drugs that are in development. Recon 2 allows researchers to use this existing gene expression data and knowledge of the entire metabolic network to figure how certain drugs would affect specific metabolic pathways found to create the conditions for cancerous cell growth, for example. They could then conduct virtual experiments to see whether the drug can fix the metabolic imbalance causing the disease.
Palsson’s Systems Biology Research Group at UC San Diego built the first virtual reconstruction of the human metabolism network, known asRecon 1, in 2007 with a six-person team. It featured more than 3,300 known biochemical reactions documented in over 50 years of metabolic research. Recon 2, which contains more than 7,400 reactions, was built by bringing together researchers from dozens of institutions around the globe in a series of “jamboree” meetings to refine and consolidate the data used in the reconstruction. Palsson said this jamboree approach helped the group establish common standards to build a consensus reconstruction, simplify its usability for biomedical researchers, and increase its transparency. Recon 2 will facilitate many future biomedical studies and is freely available at http://humanmetabolism.org.
Recon 2 is already proving its utility, according to Ines Thiele, a professor at the University of Iceland and UC San Diego alumna, who led the Recon 2 effort. Thiele earned her Ph.D. in bioinformatics as a student of Palsson’s and was part of the original Recon 1 team. Several other UC San Diego alumni, and former Palsson students, participated in the consortium from their new institutions, including Neema Jamshidi (Ph.D., 2008, M.D., 2009), who is now interning at UCLA; Jason Papin (Ph.D., 2004), a professor at the University of Virginia; and Nathan Price (Ph.D., 2005), who is a professor at the Institute for Systems Biology in Seattle, Wash.
Thiele said Recon 2 has successfully predicted alterations in metabolism that are currently used to diagnose certain inherited metabolic diseases.
“The use of this foundational resource will undoubtedly lead to a myriad of exciting predictions that will accelerate the translation of basic experimental results into clinical applications,” said Thiele. “Ultimately, I envision it being used to personalize diagnosis and treatment to meet the needs of individual patients. In the future, this capability could enable doctors to develop virtual models of their patients’ individual metabolic networks and identify the most efficacious treatment for various diseases including diabetes, cancer and neurodegenerative diseases.”
As much as Recon 2 marks a significant improvement over Recon 1, there is still much work to be done, according to the research team. Thiele said Recon 2 accounts for almost 1,800 genes of an estimated 20,000 protein-coding genes in the human genome. “Clearly, further community effort t will be required to capture chemical interactions with and between the rest of the genome,” she said.
The international consortium includes researchers from the following institutions: University of Vienna, Austria; Charité– Universitätsmedizin Berlin, Germany; Jacobs University Bremen, Germany; Center for Systems Biology, University of Iceland; Okinawa Institute Science and Technology, Japan; Luxembourg Centre for Systems Biomedicine; University of Amsterdam, the Netherlands; Netherlands Bioinformatics Centre, the Netherlands; Vrije Universiteit, Amsterdam, the Netherlands; Netherlands Consortium for Systems Biology; Institute of Cell Biophysics, Moscow region, Pushchino, Russia; Chalmers University of Technology, Sweden; University of Manchester, United Kingdom; Manchester Institute of Biotechnology, UK; Central Manchester University Hospitals NHS Foundation Trust, Manchester Academic Health Sciences Centre, UK; European Bioinformatics Institute, UK; Babraham Institute, Cambridge, UK; University of Warwick, UK; University of Edinburgh, UK; University of Sheffield, UK; University of California, San Diego; University of Virginia; Virginia Tech; Centre for Advanced Discovery and Experimental Therapeutics (CADET), University of North Texas; Genome Designs, Inc., Walnut Creek, Calif.; California Institute of Technology; and Institute for Systems Biology, Seattle, Wash.http://ucsdnews.ucsd.edu/pressrelease/international_consortium_builds_google_map_of_human_metabolism
